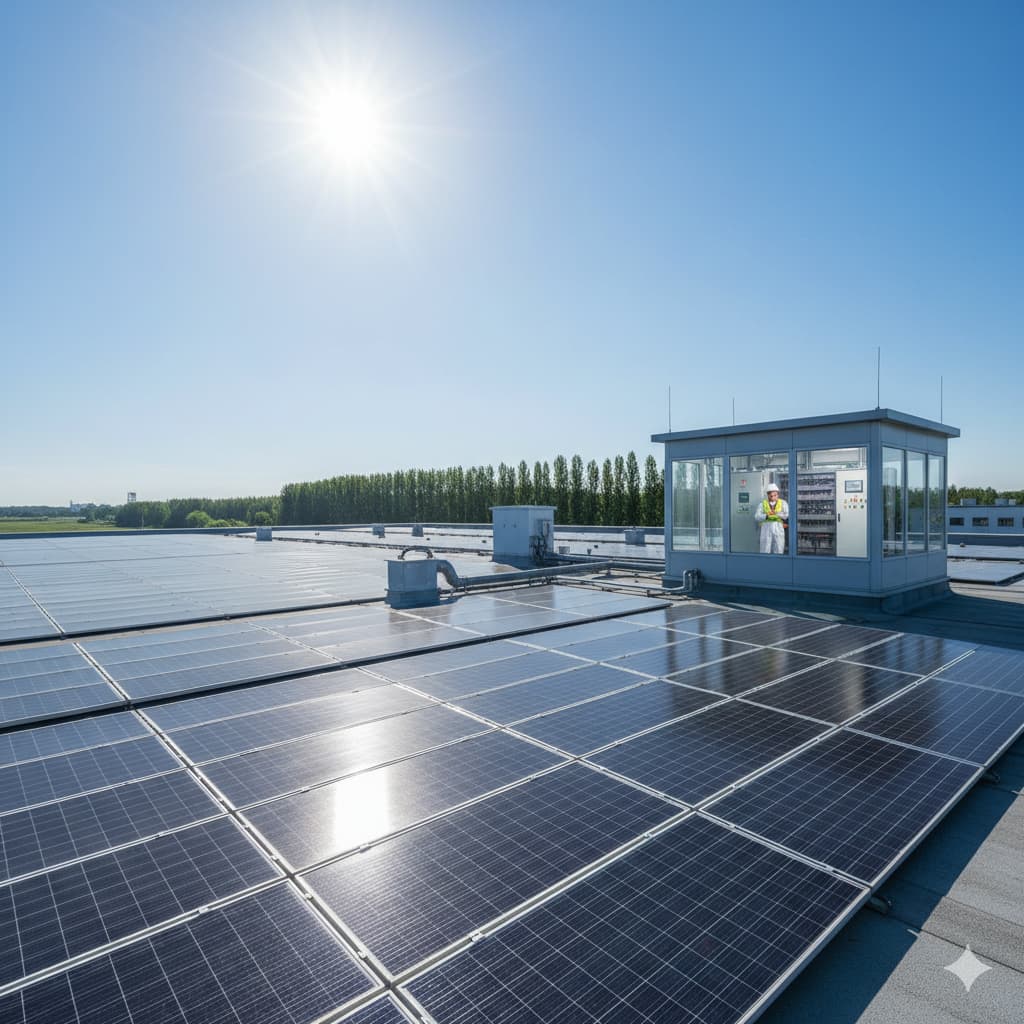
The short answer: India's commercial and industrial energy storage market is forecast to grow more than 30 times by 2032, from under 1 GWh installed today to between 23 and 31 GWh, and industrial facilities like yours are expected to account for more than half of it. That is the headline from a new report released at India Energy Storage Week 2026 in New Delhi, and in this article we explain what sits behind the number and what a factory owner in UP or the wider NCR should actually do about it.
Our engineering team at MGetEnergy has been designing and commissioning solar plus storage systems for C&I clients since well before battery storage was fashionable, so when a forecast of this scale lands, we read it the way our clients would: not as industry cheerleading, but as a signal about where power costs, reliability, and procurement options are heading over the next five to seven years.
The news: what was released at IESW 2026
The 12th India Energy Storage Week ran from 8 to 10 July 2026 at Yashobhoomi (IICC), New Delhi, bringing together over 200 exhibitors and more than 10,000 industry participants. The report that matters most for factory and commercial building owners is the one prepared by the India Energy Storage Alliance (IESA) with Customized Energy Solutions (CES), titled "India Stationary Storage Market for C&I Applications: Insights Till 2032".
Its core findings, as reported across the trade and business press:
| What the report tracks | Where it stands (2025) | Forecast for 2032 |
|---|---|---|
| C&I renewable energy capacity in India | 32 GW | Up to 100 GW (roughly tripling) |
| C&I energy storage installed | Under 1 GWh | 23 to 31 GWh (a 30x plus increase) |
| Business as Usual scenario | Assumes 5 to 6% annual C&I load growth, 15% RE growth | 22 to 23 GWh |
| Rapid Adoption scenario | Assumes 18% RE growth with supportive reforms | Up to 31 GWh |
| Largest adopter segment | Industrial facilities, projected to take more than half of all C&I storage installations | |
| Fastest growing segments | Data centres, hospitals, metro and railway stations, airports | |
Figures compiled from the IESA and CES report "India Stationary Storage Market for C&I Applications: Insights Till 2032" as released at IESW 2026 (8 to 10 July 2026) and reported in the business and trade press. Forecasts are scenario projections, not guarantees. Always verify against the published report and the regulations in force before making procurement decisions.
The same week produced a useful national backdrop. The companion India BESS Market Review, released at the IESW opening, projects India's total energy storage requirement rising from about 1 GWh today to 888 GWh by 2035-36. It also recorded that India's installed battery storage capacity jumped from 0.78 GWh in December 2025 to 8.7 GWh by June 2026, an 11 fold increase in six months, with roughly 47 GWh of storage tenders floated in the first half of 2026 alone and a cumulative tender pipeline of around 260 GWh.
In plain terms: the storage market India has been promising for a decade arrived in the last six months, and the C&I segment is forecast to be the next wave.
Why the forecast is credible, in our reading
Forecasts of 30x growth deserve scepticism, so here is why we think this one rests on solid ground.
First, the drivers are cost pressures you already feel. The report attributes the growth to rising grid tariffs, the need for reliable high quality power, rapid renewable adoption, cost optimisation demands, and corporate decarbonisation commitments. None of those is speculative. If you run a factory in the Greater Noida, Noida, Ghaziabad, or Faridabad industrial belts, you have watched every one of these pressures build on your monthly electricity bill and your diesel logbook.
Second, the base is real, not projected. The 11 fold jump in national installed battery capacity in H1 2026 already happened. Tenders worth 47 GWh were actually floated. Eighteen battery projects are commissioned and operating. The C&I forecast is an extension of a curve that is already bending, not a hope that it might.
Third, the technology question has largely settled. The report notes that lithium iron phosphate (LFP) batteries now dominate C&I storage, with flow batteries and sodium ion emerging for long duration needs. A settled dominant chemistry means a maturing supply chain, more predictable pricing, and more bankable warranties. For readers who want the component level detail on how a battery system is put together, our complete guide to battery energy storage systems covers BMS, PCS, and EMS building blocks.
The most important line in the report
The single most useful sentence for a C&I buyer is not a number. It is the finding that the market is shifting from simple backup power to application driven storage. The report names three applications leading that shift, and each one maps directly to a decision our clients are already facing.
1. Integrating open access renewable power
As more factories buy solar and wind through open access and group captive arrangements, storage increasingly earns its keep by absorbing scheduling mismatches and making cheaper contracted power usable across more hours of the day. If you have not yet decided how to procure solar in the first place, start with our comparison of rooftop vs open access vs group captive routes for 2026, because the procurement route you choose shapes whether and where storage fits.
2. Replacing diesel generators
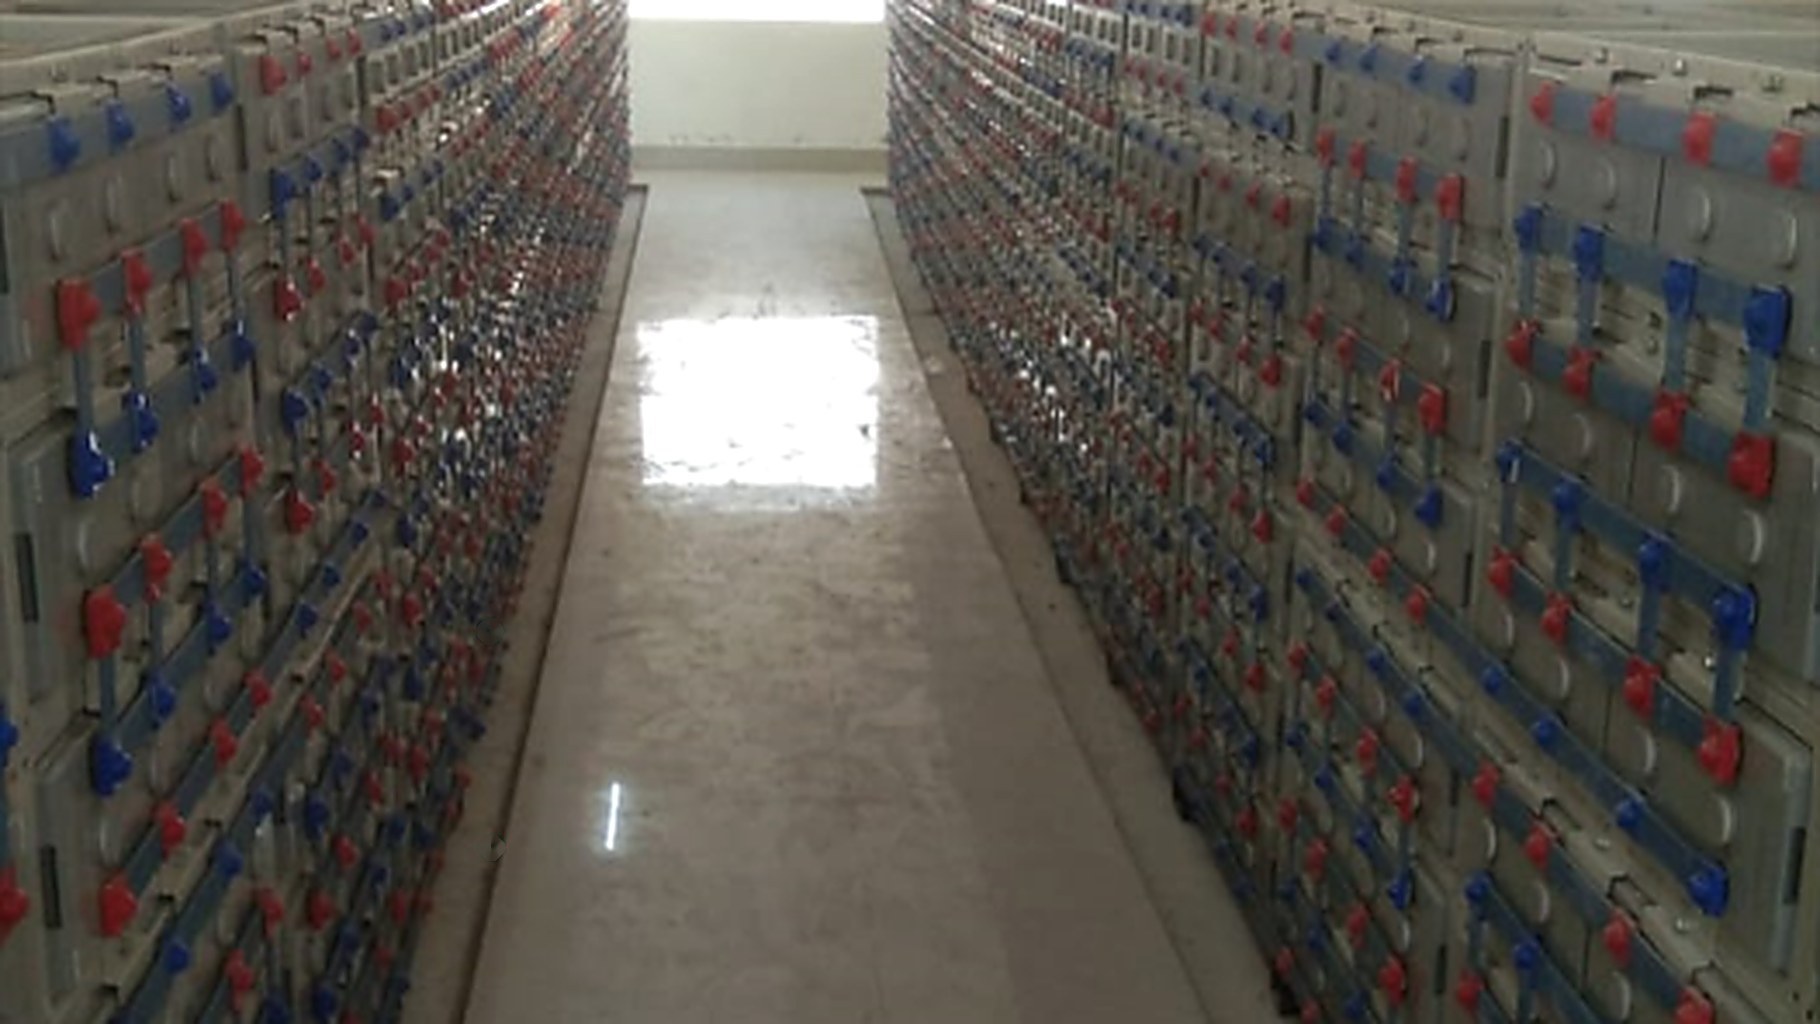
Diesel gensets remain the default outage insurance at most Indian plants, and they remain painfully expensive to actually run, typically ₹18 to ₹24 per unit generated once fuel and maintenance are counted. The report identifies DG replacement as one of the fastest growing storage applications, and this matches what we see on the ground: the conversation has moved from "can a battery replace my DG" to "for how many hours, and at what size". We will publish a dedicated deep dive on the DG replacement decision soon; for now, the key point is that the report confirms this is where much of the 30x growth is expected to come from.
3. Integrating rooftop solar
The third application is pairing storage with rooftop solar so that midday generation serves evening consumption. This has become steadily more valuable as metering regimes shift toward rewarding self consumption; our explainer on the 2026 net metering changes for C&I consumers covers why the export compensation you were counting on may look different going forward.
What the forecast means for your factory, practically
It means your peers are moving. When a credible industry body projects that industrial facilities will take more than half of a 23 to 31 GWh market, it is telling you where the reference sites, the vendor attention, and the competitive benchmarks are going to be. In our experience, the plants that adopt early in a cycle like this get the best engineering attention and set the cost benchmarks their competitors later chase.
It means storage is becoming a procurement category, not an experiment. IESA's own framing is that C&I storage is transitioning from backup and peak shaving to a strategic asset for energy optimisation, resilience, and decarbonisation. Boards and CFOs treat strategic assets differently: they expect a structured evaluation, not a pilot. If that evaluation is on your desk, our five factor BESS decision framework for C&I buyers is the structured screen we use with clients, and our CFO's avoided cost model for solar plus BESS is the financial companion to it.
It does not mean you should wait for prices to bottom out. A common instinct is to sit out a fast growing market and buy later, cheaper. Two cautions. One, the same IESW week recorded that battery prices have recently faced upward pressure from global supply chain volatility, so the assumption of smoothly falling prices is not guaranteed year to year. Two, policy support has expiry dates: concessional transmission waivers for renewable projects are already in their phase down window, a clock we explained in our procurement routes article. Waiting has a real cost in avoided savings foregone every month, and that cost usually outweighs the speculative benefit of a cheaper battery two years from now. The honest answer is to run the numbers for your specific plant rather than time the market.
It means hybrid designs deserve a fresh look. We have delivered solar plus storage hybrids for clients such as Kapil Muni Agro Foods, a 250 KW solar with 600 KWh storage system at their agro processing plant in Mainpuri, UP, where outage protection and diesel displacement justified storage well before any national forecast said it would. The economics that worked there are becoming mainstream, which is exactly what a 30x forecast describes.
What we would do this quarter
If the forecast prompts you to act, here is the sequence we recommend to clients, and it costs almost nothing to start.
Pull your last 12 months of electricity bills and DG running logs. Establish three numbers: your peak demand pattern, your monthly diesel spend, and the share of your consumption that falls in evening and night hours. Then run those numbers through a structured screen before talking to any vendor. That is precisely what our five factor framework exists for, and if your plant scores as a strong candidate, the financial modelling comes next. If you are earlier in the journey and solar itself is the open question, our guide to 1 MW solar plant costs in India for 2026 is the right starting point, because storage economics always sit on top of solar economics, never instead of them.
We structure this evaluation on the buyer's side of the table: load assessment first, technology and sizing recommendations second, and procurement support last, so the system you buy is sized for your load profile rather than a vendor's inventory.
How MGetEnergy can help
MGetEnergy has delivered 45+ MWp across 400+ installations in 8+ states, including hybrid solar plus storage systems for factories, cold storages, and agro processing plants across UP and the NCR. From our base in the Kasna industrial area of Greater Noida, we design, engineer, and maintain hybrid and battery storage solutions built around your actual load data.
If the 30x forecast has put storage on your agenda, contact MGetEnergy today for a no obligation load assessment, or write to us at wecare@mgetenergy.com. We will tell you honestly whether storage pays at your plant now, later, or not yet.
Frequently asked questions
What does the new IESA and CES report actually forecast?
It projects India's C&I renewable energy capacity growing from 32 GW in 2025 to as much as 100 GW by 2032, and C&I energy storage installations growing from under 1 GWh to between 23 and 31 GWh over the same period, which is more than a 30x increase.
Who is expected to install most of this storage?
Industrial facilities are projected to account for more than half of all C&I storage installations, with data centres and critical infrastructure such as hospitals, metro and railway stations, and airports growing fastest from a smaller base.
What are the three storage applications the report highlights?
Integrating open access renewable power, replacing diesel generators, and integrating rooftop solar. The report describes the market shifting from simple backup power to application driven storage designed around one or more of these uses.
Does the 30x forecast mean battery prices will keep falling?
Not necessarily year to year. The broader IESW 2026 reporting noted recent upward price pressure from global supply chain volatility. The long term trend has favoured buyers, but timing the market is risky, and the monthly savings foregone by waiting are a real cost.
Should my factory wait before evaluating storage?
Evaluating costs almost nothing, so no. Pull 12 months of bills and DG logs, establish your peak demand pattern and diesel spend, and run a structured screen. Whether to actually buy depends on your plant's specific numbers, which is exactly what the evaluation reveals.
Which battery chemistry dominates C&I storage in India?
Lithium iron phosphate (LFP) dominates current C&I installations, with vanadium redox flow and sodium ion chemistries emerging as options for long duration requirements. A settled dominant chemistry generally means a more mature supply chain and more bankable warranties.
How do I know if my plant is a good storage candidate?
Strong candidates typically have significant peak demand charges, meaningful diesel generator running hours, evening or night shift consumption, and existing or planned solar capacity. A structured five factor screen against your actual load data gives a clear yes, no, or not yet answer.
Disclaimer: This article summarises market forecasts and industry reporting available as of July 2026 for general information. Forecast figures are scenario projections by their publishers, not commitments or guarantees. Storage economics depend on your specific load profile, tariff category, DISCOM, and applicable regulations, all of which change over time. Nothing here is a quotation or an offer. Please verify current regulations and consult MGetEnergy for an assessment specific to your facility.